Here’s what a $1,000 investment has returned every year since 1950
My last post about the importance of long-term investing and ignoring the short term ‘noise’ proved to be very popular; thank you for all your feedback.
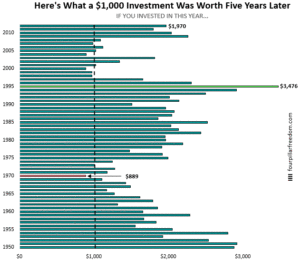
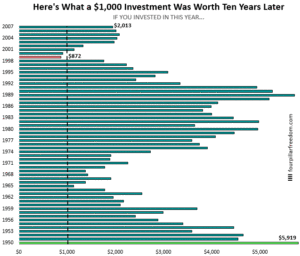
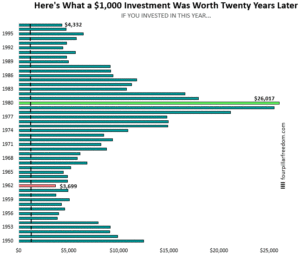
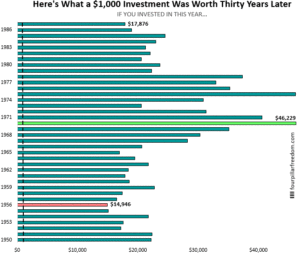
To further emphasise the potential value of investing in stock markets the following charts show how much a $1,000 investment in the S&P 500 was worth 5, 10, 20, and 30 years after being invested. The charts go back to 1950 and assume any dividends were reinvested.
Some Interesting Observation
The S&P 500 only lost money twice during any ten year period since 1950. This means if you invested $1,000 in any given year, ignored the market, and checked your investment 10 years later, in 56 out of the 58 ten year periods you would have made money.
-
- The S&P 500 only lost money twice during any ten year period since 1950. This means if you invested $1,000 in any given year, ignored the market, and checked your investment 10 years later, in 56 out of the 58 ten year periods you would have made money.
- On average, an investment in the S&P 500 would have tripled in value over any ten year period.
- An investment during the worst 30 year period since 1950 still would have increased in value nearly 15 times.
- In the short term, the market fluctuates wildly and it’s possible to lose money on an investment, but over the long term the market has been a money-making machine for people who remain invested.
Enjoy!
How to interpret this graph: A $1,000 investment in the S&P 500 in 2012 was worth $1,970 five years later.
Highest 5 year return: $3,476 (1995 – 1999)
Lowest 5 year return: $889 (1970 – 1974)
Average 5 year return: $1,777
How to interpret this graph: A $1,000 investment in the S&P 500 in 2007 was worth $2,013 ten years later.
Highest 10 year return: $5,919 (1950 – 1959)
Lowest 10 year return: $889 (1999 – 2008)
Average 10 year return: $3,001
How to interpret this graph: A $1,000 investment in the S&P 500 in 1997 was worth $4,332 twenty years later.
Highest 20 year return: $26,017 (1980 – 1999)
Lowest 20 year return: $3,699 (1962 – 1981)
Average 20 year return: $8,879
How to interpret this graph: A $1,000 investment in the S&P 500 in 1987 was worth $17,876 thirty years later.
Highest 30 year return: $46,229 (1970 – 1999)
Lowest 30 year return: $14,946 (1956 – 1985)
Average 30 year return: $24,478
Recent Posts
-
22 August 2024
-
19 June 2023
-
12 April 2022
-
25 February 2022
-
17 January 2022
Archives
- August 2024
- June 2023
- April 2022
- February 2022
- January 2022
- November 2021
- September 2021
- February 2021
- August 2020
- June 2020
- January 2020
- August 2019
- July 2019
- June 2019
- November 2018
- September 2018
- July 2018
- June 2018
- April 2018
- August 2017
- May 2017
- April 2017
- February 2017
- July 2016
- June 2016
- May 2016
- March 2016
- November 2015
- September 2015
- May 2015
- January 2015
- November 2014


